
Commercial HVAC Retrofit ROI in Oklahoma: How to Calculate Payback, NPV, and Risk (Facility + CFO Guide)
A practical framework for Oklahoma facilities to calculate HVAC retrofit ROI: baseline energy, maintenance and downtime costs, incentives, simple payback vs NPV, and risk-adjusted decisions.
Commercial HVAC Retrofit ROI in Oklahoma: How to Calculate Payback, NPV, and Risk (Facility + CFO Guide)
A commercial HVAC retrofit decision is rarely about one number. Facility teams want reliability, better control, and fewer emergency calls. CFOs want predictable cash flow, risk reduction, and defensible CapEx. In Oklahoma, the ROI picture is shaped by high summer demand, humidity control requirements (especially healthcare), and the reality that a chiller failure in July can cost more than a year of “energy savings.”
This guide walks through a practical ROI model you can use to compare options and build an approval-ready business case.
For chiller-heavy scopes, combine this with our commercial chiller TCO comparison framework so procurement and operations are using the same lifecycle assumptions.
Quick Answer
ROI Calculation Quick Reference
| Metric | Formula | Best For |
|---|---|---|
| Simple Payback | Project Cost ÷ Annual Savings | Quick screening |
| NPV | Sum of discounted cash flows - initial cost | Investment approval |
| IRR | Discount rate where NPV = 0 | Comparing investments |
| Lifecycle Cost | Total cost over planning horizon | Operations planning |
Step 1: Define the decision you’re actually making
Most “retrofit ROI” debates go sideways because the scope is fuzzy. Clarify:
| Question | Why It Matters |
|---|---|
| End of life or early retrofit? | Changes baseline comparison |
| Energy, reliability, or compliance? | Determines what savings to count |
| Time horizon (5, 10, 15, 20 years)? | Affects NPV and lifecycle cost |
| What risk are you reducing? | Quantifies downtime avoidance value |
If you don’t define the problem, your ROI model will look “good” on paper and fail in real operations.
Step 2: Build a baseline that’s more than “last month’s bill”
Your baseline should include:
Baseline Components
| Category | Data Needed | Source |
|---|---|---|
| Energy | 12 months kWh, peak demand | Utility bills, BAS trends |
| Maintenance | PM costs, repair history | Service records |
| Downtime | Events, duration, impact | Incident logs |
A) Energy baseline (kWh and demand)
Use at least 12 months of data when possible:
- monthly kWh
- peak demand (kW) and demand charges if applicable
- weather normalization if you have it (hot summers matter here)
If you have a BAS, pull trend data for:
- runtime hours
- leaving water temps / discharge air temps
- reheat behavior (humidity control impact)
B) Maintenance baseline (planned + unplanned)
Capture the reality:
- PM contract cost or internal labor estimate
- common repair items over the last 3–5 years
- emergency call patterns (frequency and severity)
C) Downtime baseline (the cost people avoid quantifying)
Downtime cost varies by facility type:
| Facility Type | Downtime Impact | Typical Cost Range |
|---|---|---|
| Hospitals | Clinical disruption, compliance risk | $5,000-50,000+ per event |
| Industrial | Production loss, scrap | Revenue-dependent |
| Hospitality | Guest experience, revenue | $1,000-10,000+ per event |
| Education | Event disruption, safety | Reputational + operational |
You don’t have to pretend you can compute this perfectly. You do need a defensible range.
Step 3: Choose which ROI metric you’re using (and why)
ROI Metric Comparison
| Metric | Pros | Cons | When to Use |
|---|---|---|---|
| Simple Payback | Easy to explain, fast | Ignores time value, risk | Initial screening |
| NPV | Accounts for time value | Requires discount rate | Final approval |
| IRR | Finance-friendly | Can mislead with irregular flows | Comparing projects |
| Lifecycle Cost | Operations-focused | Complex to calculate | Long-term planning |
Simple Payback (quick screen)
Simple Payback (years) = Net Project Cost ÷ Annual SavingsNPV (Net Present Value) (approval-grade)
NPV answers: “Is this better than the alternative use of capital?”
NPV = Σ (Net Cash Flow at year t ÷ (1 + r)^t) − Initial CostWhere r is your discount rate (e.g., 8%).
IRR (Internal Rate of Return) (finance-friendly)
IRR is the discount rate where NPV = 0. Useful when comparing investments, but it can be misleading if cash flows are irregular. Use it as a comparison metric—not the only decision gate.
Lifecycle Cost (LCC) (facility-friendly)
Lifecycle cost is often the clearest for operations: total cost to own and operate over the horizon.
Step 4: Map retrofit options to savings categories
Most retrofit business cases combine multiple savings types:
Savings Category Matrix
| Savings Type | Examples | How to Quantify |
|---|---|---|
| Energy | Higher efficiency, VFDs, controls | kWh and demand reduction |
| Maintenance | Fewer repairs, less emergency calls | Historical repair costs |
| Operational/Risk | Reduced July downtime, compliance | Avoided incident costs |
If you only count energy savings, you often under-value the best retrofits.
In industrial environments, these operational savings are often driven by controls and ventilation strategy documented in our manufacturing HVAC solutions guide.
Annual Energy Cost
Saved $50,000 USD
Step 5: Include incentives without “making up” numbers
Incentives can materially improve ROI, but programs change. Your model should:
| Incentive Item | Status | Amount | Verification Date |
|---|---|---|---|
| Utility rebate (OG&E/PSO) | Verified | $XX,XXX | Date confirmed |
| Federal tax credits | Pending | $XX,XXX | Expected approval |
| State programs | Research needed | TBD | N/A |
For Oklahoma commercial incentives, start with your utility programs and confirm current requirements and availability.
Step 6: Use a worksheet model (example structure)
ROI Worksheet Template
| Category | Line Item | Amount |
|---|---|---|
| Project Cost | Equipment | $ |
| Installation | $ | |
| Controls/commissioning | $ | |
| Contingency | $ | |
| Total Project Cost | $ | |
| Annual Savings | Energy (kWh + demand) | $ |
| Maintenance reduction | $ | |
| Avoided downtime | $ | |
| Total Annual Savings | $ | |
| Annual Added Costs | Increased PM requirements | $ |
| Service agreements | $ | |
| Water treatment (if applicable) | $ | |
| Total Added Costs | $ | |
| Net Annual Benefit | $ |
Step 7: Add sensitivity analysis (this is what makes it credible)
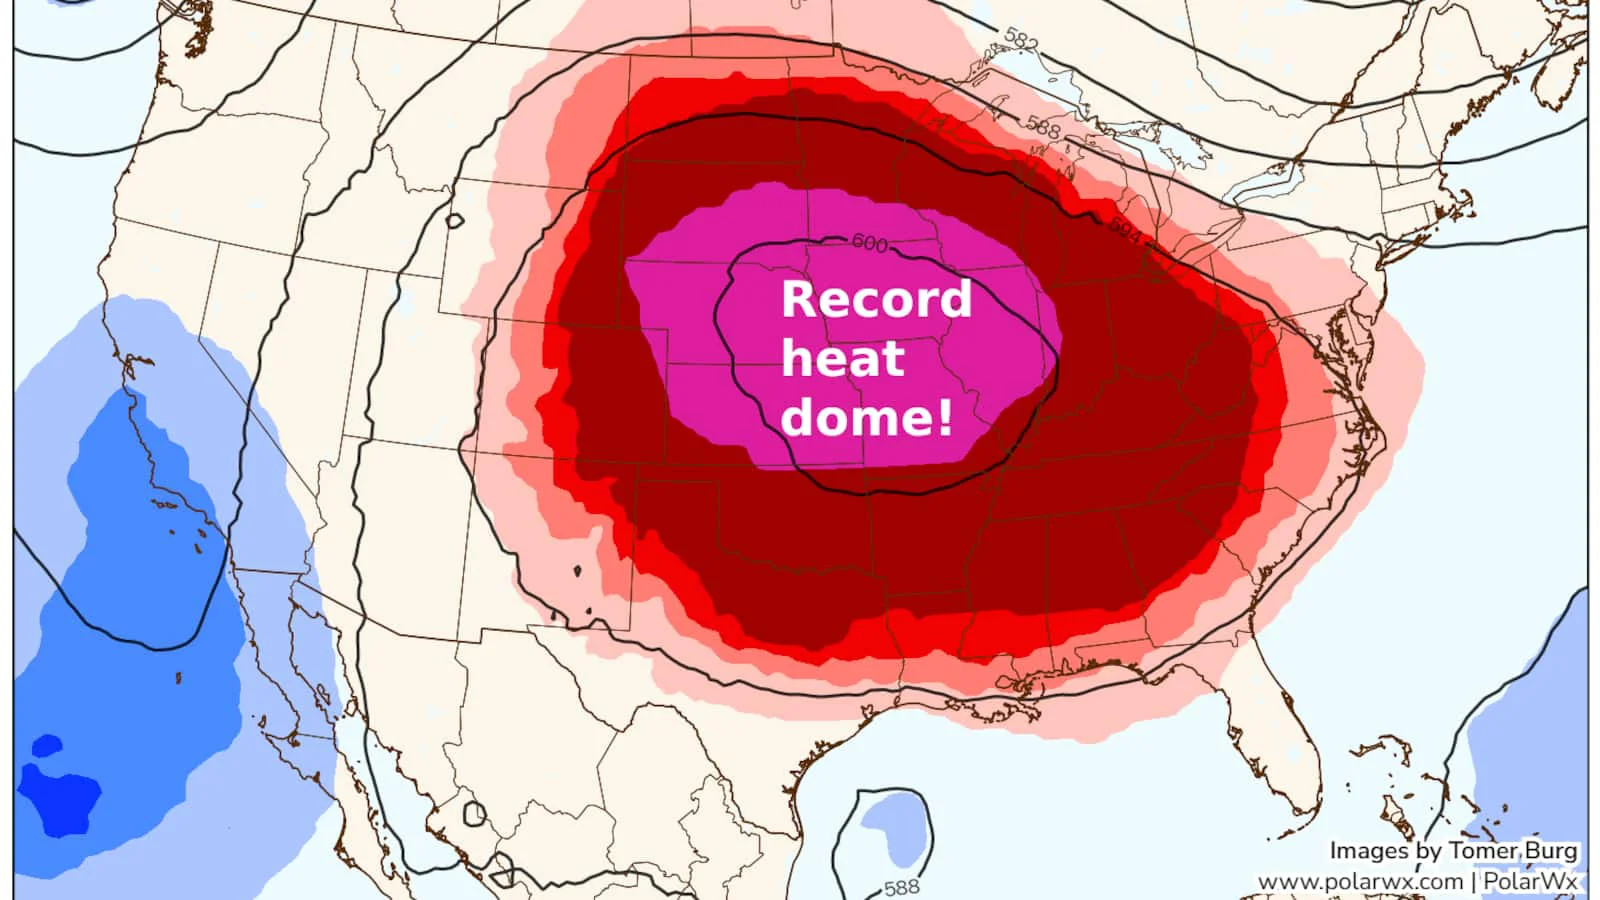
In Oklahoma, your savings will vary by:
- summer severity (hot years vs mild years)
- building occupancy and operating hours
- water quality and tower chemistry stability
- how well the facility executes maintenance
For climate-stress assumptions, anchor your scenarios to this Oklahoma heat dome protection playbook.
Sensitivity Analysis Framework
| Scenario | Energy Savings | Downtime Value | Incentives |
|---|---|---|---|
| Conservative | 15% below estimate | Low end of range | None |
| Expected | Estimate | Mid-range | Verified only |
| Aggressive | 15% above estimate | High end | All pending |
If your ROI only works under one perfect set of assumptions, it’s not a strong project.
A worked example (illustrative numbers only)
Example ROI Calculation
| Item | Value |
|---|---|
| Net project cost after incentives | $450,000 |
| Annual energy savings | $55,000 |
| Annual maintenance savings | $18,000 |
| Annual avoided downtime (conservative) | $20,000 |
| Total annual benefit | $93,000 |
| Simple payback | 4.8 years |
The point isn’t the exact answer—it’s that the model includes both energy and operational risk.
Oklahoma-specific guidance: how we see retrofits succeed
Success vs. Struggle Factors
| Retrofits Succeed When… | Retrofits Struggle When… |
|---|---|
| Performance validated under peak summer | Designed for generic climate |
| Coil/tower maintenance included in plan | No maintenance plan for new system |
| Controls sequencing addressed | Controls not tuned post-install |
| Commissioned and trended after install | Assumed correct without verification |
When to call for professional help
Bring in support when:
- you need a defensible energy baseline and measurement plan
- the facility has complex sequencing (multiple chillers/boilers, critical AHUs)
- compliance and humidity control are key drivers (healthcare)
- you need incentive coordination and documentation planning
Need help building an ROI case for a retrofit in Oklahoma?
Total Mechanical Services supports retrofit planning, controls-focused troubleshooting, and lifecycle decision support for commercial facilities across Oklahoma. Call (405) 223-9900 or request a proposal.
Disclaimer: This guide is informational. Actual ROI depends on site conditions, utility tariffs, equipment selection, commissioning quality, and maintenance execution. Always verify incentive eligibility and requirements through official program sources.
Related Resources
Protecting Commercial HVAC From Oklahoma Heat Domes: High-Ambient Strategy, Coil Cleaning, and Load Management
A practical Oklahoma guide to surviving heat domes: high-ambient chiller/RTU performance, coil cleaning cadence, tower readiness, demand management, and emergency cooling planning.

Oklahoma Ice Storm HVAC Recovery: Freeze Damage Triage, RTU/Chiller Plant Checks, and Safe Restart
A practical Oklahoma guide to recovering HVAC after ice storms: pre-storm prep, freeze damage triage, thaw and restart strategy, and documentation for insurance and risk control.
RTU Winterization Checklist for Oklahoma Ice Storms: Freeze Protection, Hail Risk, and Start-Up
A practical rooftop unit winterization checklist for Oklahoma facilities: freeze protection, condensate and economizer checks, hail prep, and post-storm start-up steps.
Need Help with Your System?
Our expert team is ready to assist with design, installation, maintenance, and troubleshooting.