Vibration Analysis for Centrifugal Chillers: Catch Bearing and Alignment Problems Early
A practical guide to vibration analysis on centrifugal chillers: what to trend, what patterns typically mean, and how to use vibration + oil analysis to prevent outages.
Vibration Analysis for Centrifugal Chillers: Catch Bearing and Alignment Problems Early
Centrifugal chillers don’t usually fail “all at once.” They drift. Vibration analysis is one of the best ways to catch that drift early—before you’re staring at an alarm screen during a heat wave. For Oklahoma facilities with mission-critical cooling, vibration analysis (paired with oil analysis and good operating trend logs) is a practical, real-world predictive maintenance tool: it reduces emergency shutdowns, helps you plan repairs, and protects the most expensive rotating components in the plant.
Quick Answer: What does vibration analysis tell you?
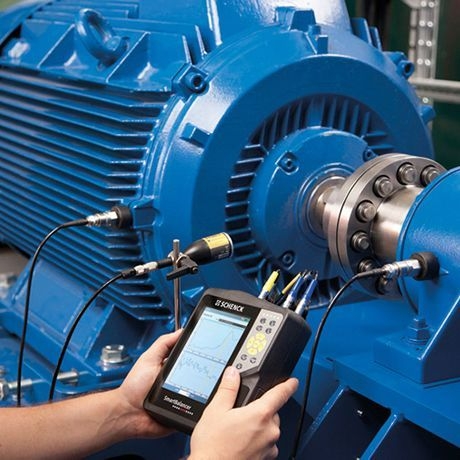
Vibration analysis detects changes in the mechanical condition of rotating equipment—bearings, alignment, imbalance, looseness, and sometimes aerodynamic or electrical issues—by analyzing vibration levels and frequency patterns over time. For centrifugal chillers, trending vibration helps you identify developing problems early enough to plan corrective action instead of reacting to a lockout during peak cooling demand.
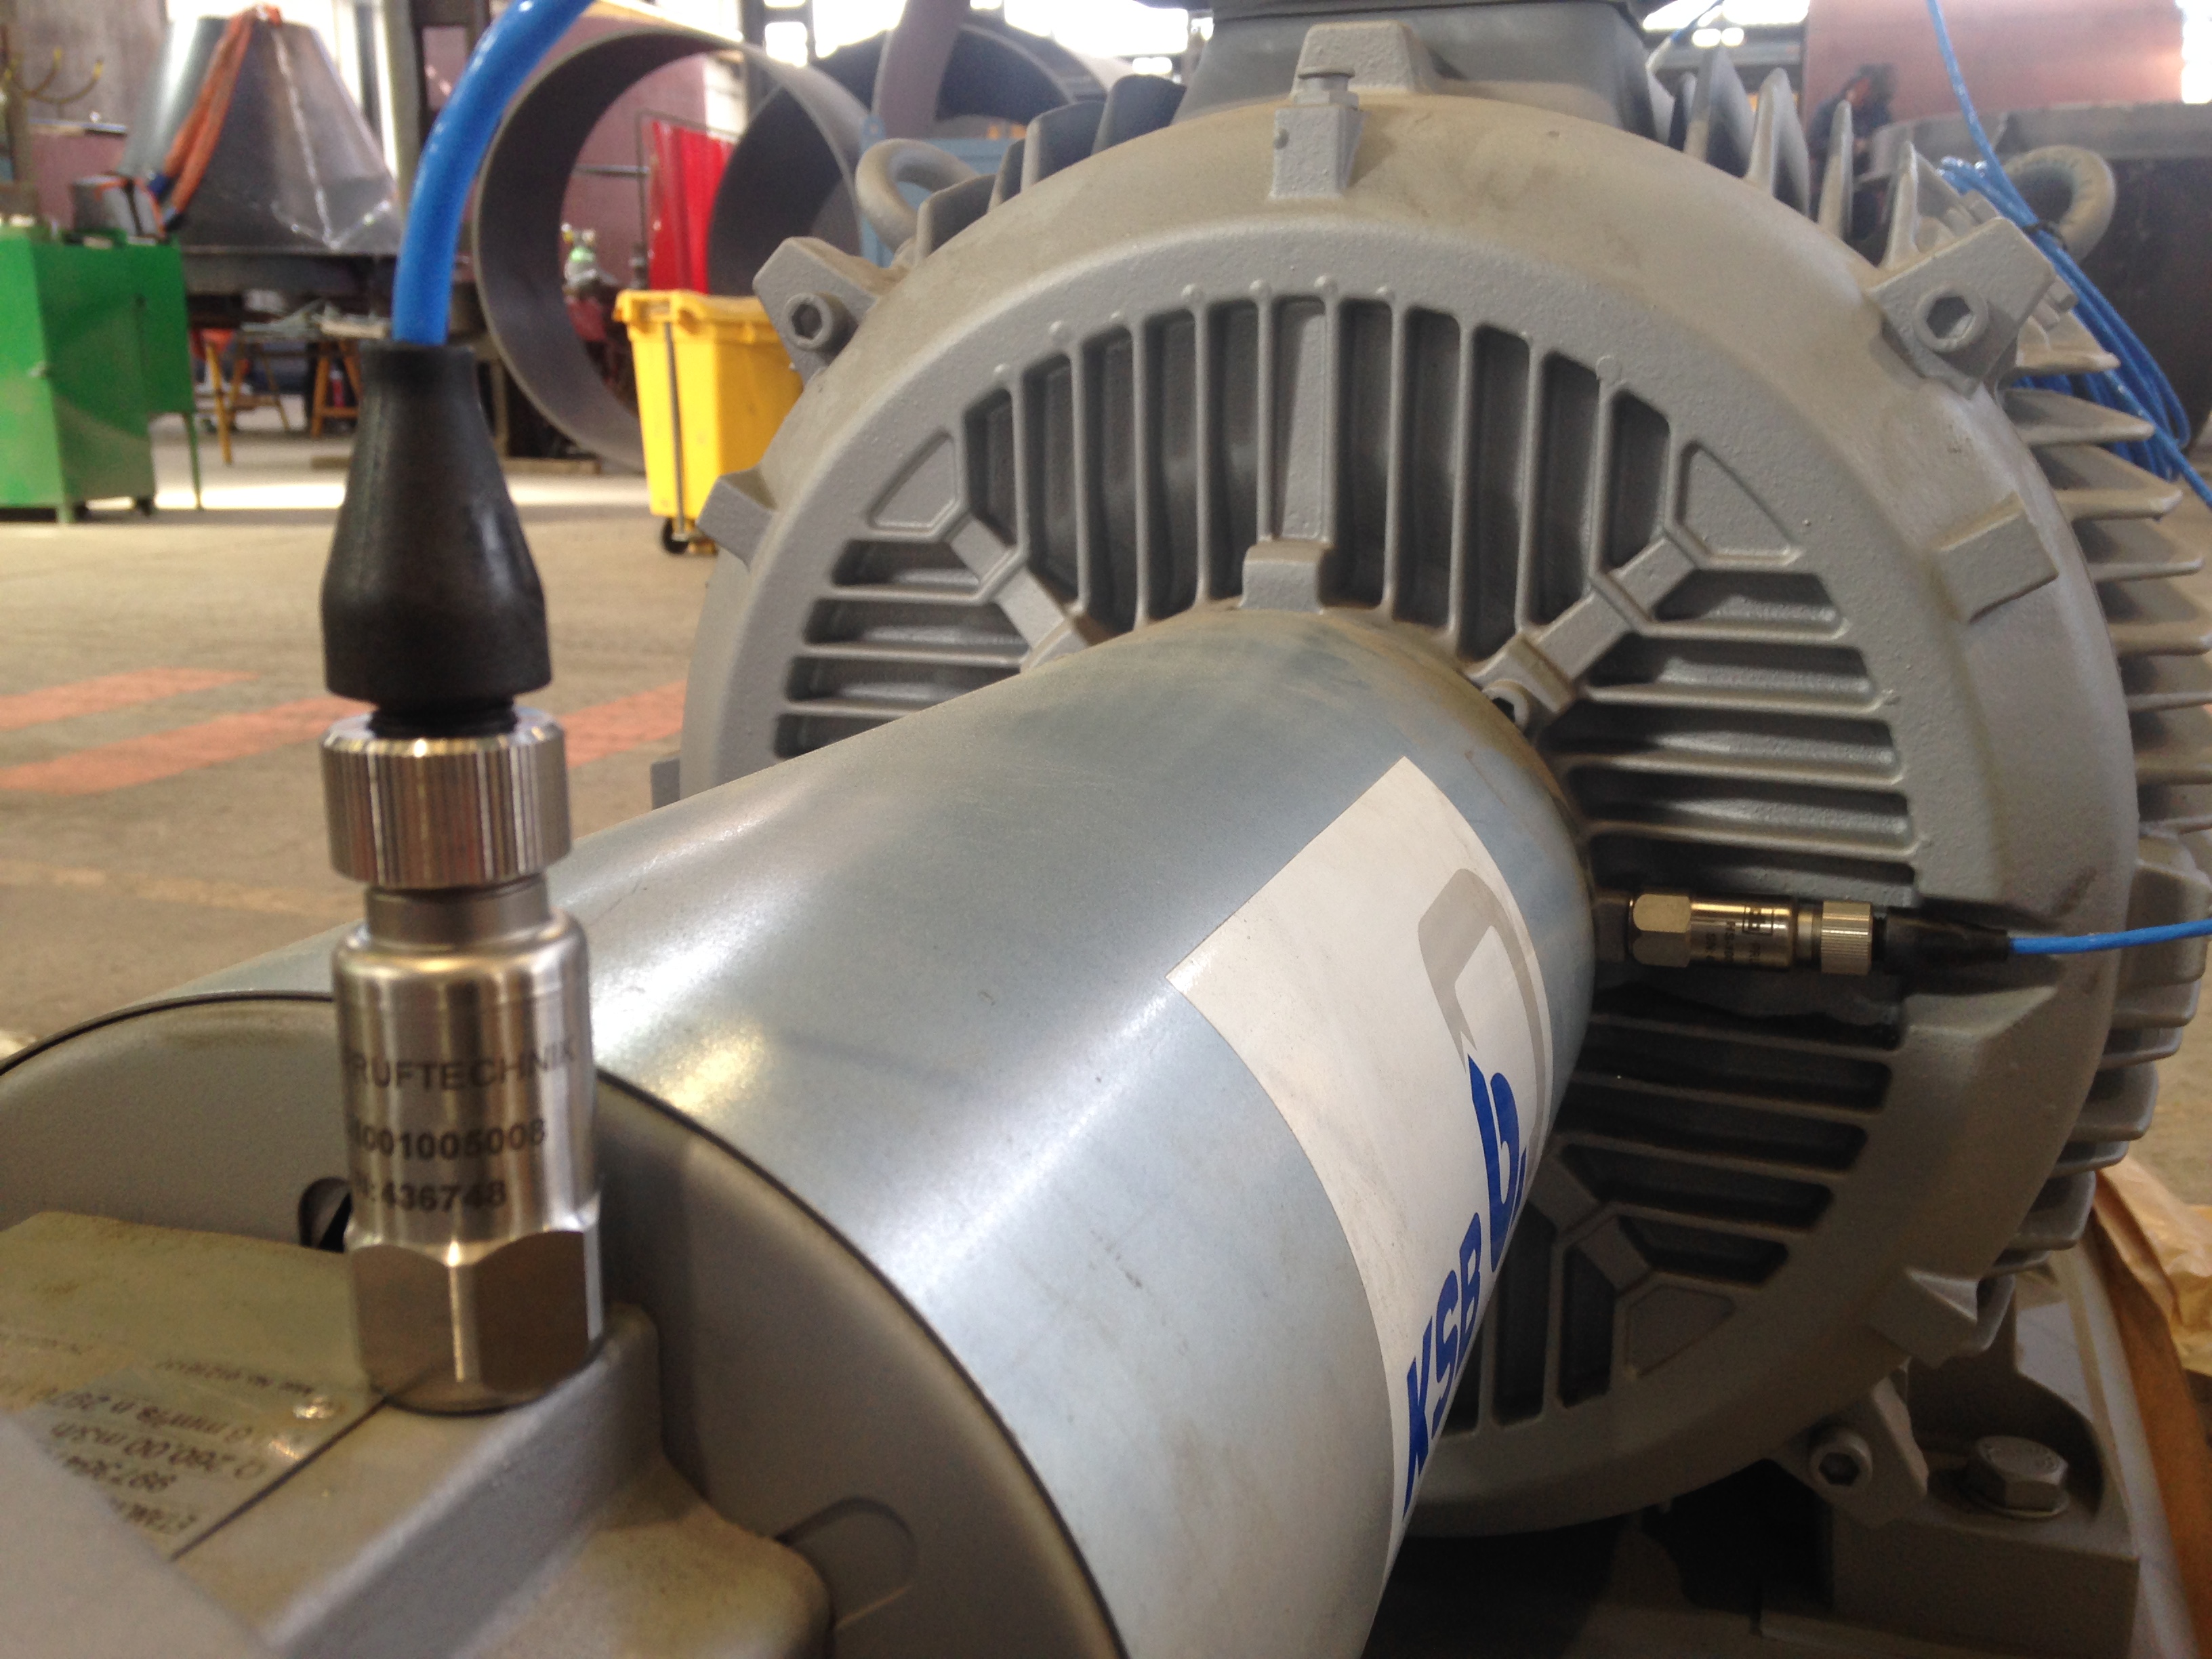
Photo credit: power-mi.com
Why centrifugal chillers benefit so much from vibration trending
Centrifugal machines are efficient and powerful, but they operate with tight tolerances. Small changes—bearing wear, coupling issues, rotor imbalance—can show up as vibration changes long before a failure becomes obvious.
| Detection Method | Detection Timing | Typical Lead Time | Planning Benefit |
|---|---|---|---|
| Vibration Analysis | Early stage | 3-6 months before failure | Schedule planned outage |
| Oil Analysis | Early-to-mid stage | 2-4 months before failure | Correlate with vibration data |
| Operator Observation | Mid-to-late stage | Days to weeks | Reactive response |
| Alarm/Trip | Failure imminent | Hours to immediate | Emergency repair |
The practical advantage is simple:
- Without vibration data: you learn about the problem when the machine trips or becomes noisy.
- With vibration data: you can schedule maintenance and avoid collateral damage.
Average Bearing Failure Repair Cost
Saved $67,000 USD
The Oklahoma angle: why predictive maintenance matters more here
In Oklahoma, many chiller plants see “stress tests” during:
| Season/Event | Challenge | Impact on Chiller |
|---|---|---|
| Extended heat events | High condenser pressure margin gets tight | Increased bearing loads |
| Windy dust/cottonwood periods | Coil/tower performance worsens | Higher operating stress |
| Seasonal changeover | Unstable loading and cycling | Start/stop thermal stress |
| Storm power events | Unexpected restarts | Potential startup damage |
Those are the exact times you least want a surprise mechanical failure.
What to measure (and where)
Exact measurement points vary by machine and installation, but a useful program includes:
| Measurement Point | Parameters | Purpose |
|---|---|---|
| Compressor bearings | Overall velocity, acceleration | Detect bearing wear/damage |
| Motor bearings | Overall velocity, envelope | Detect electrical and mechanical issues |
| Gearbox (if applicable) | Velocity, gear mesh frequencies | Detect gear tooth wear |
| Coupling area | Axial and radial readings | Detect misalignment |
| Base/foundation | Overall displacement | Detect looseness/mounting issues |
The key is not a single reading—it’s a repeatable baseline and consistent trend.
Baseline first: the part most programs skip
A baseline is your “normal.” Without it, you’re guessing.
We recommend collecting baseline data:
- after commissioning or a major service event
- under stable operating conditions
- across normal operating load ranges where possible
Once baseline exists, the program becomes much more effective at identifying meaningful changes.
Interpreting vibration patterns (high-level, practical)
You don’t need to become a vibration analyst to use vibration analysis effectively, but you should understand common patterns:
| Problem Type | Frequency Pattern | Common Causes | What to Check |
|---|---|---|---|
| Imbalance | Strong 1X running speed | Buildup, mechanical changes, component issues | Impeller condition, cleanliness |
| Misalignment | 1X, 2X with directional differences | Post-maintenance, coupling issues, thermal growth | Coupling alignment, pipe strain |
| Mechanical Looseness | Broadband increases, multiple frequencies | Mounts, baseplate issues, structural problems | Bolts, grouting, foundation |
| Bearing Wear | Higher-frequency components, trending increase | Age, contamination, lubrication issues | Oil analysis, bearing clearances |
| Electrical Issues | 2X line frequency | Rotor/stator eccentricity, electrical imbalance | Motor diagnostics |
Imbalance
- Often shows up strongly at running speed
- Can be caused by buildup, mechanical changes, or component issues
Misalignment
- Often shows harmonics and directional differences
- Can follow maintenance work or coupling issues
Mechanical looseness
- Often shows broadband increases and multiple frequencies
- Can come from mounts, baseplate issues, or structural problems
Bearing wear
- Can show higher-frequency components and trending increases over time
- Often correlates with oil analysis results (metal content, viscosity changes)
In practice, the key is “trend + corroborate.” A single spectral hint isn’t enough; trend changes and corroborate with other condition data.
Photo credit: pumpsandsystems.com
Pair vibration analysis with oil analysis (better together)
For many centrifugal chillers, oil analysis adds a second independent signal:
| Oil Analysis Parameter | What It Indicates | Correlation with Vibration |
|---|---|---|
| Viscosity change | Lubricant degradation | May precede vibration changes |
| Metal content (Fe, Cu, Sn) | Wear particles | Often correlates with high-frequency vibration |
| Contamination (water, acids) | Lubricant contamination | Can accelerate bearing wear patterns |
| Particle count | Debris level | Early indicator before vibration spikes |
When vibration trend changes and oil analysis flags abnormal results, your confidence in the diagnosis goes way up—and your planning becomes more precise.
Recommended cadence (what’s realistic)
Cadence depends on criticality:
| Facility Type | Vibration Analysis | Oil Analysis | Special Considerations |
|---|---|---|---|
| Healthcare/Data Centers | Quarterly | Quarterly | Higher frequency during peak season |
| Process/Industrial | Quarterly | Quarterly | Coordinate with production schedules |
| Standard Commercial | Semi-annual | Semi-annual | Targeted checks during peak season |
| Hospitality | Semi-annual | Annual | Increase before peak occupancy |
After any significant maintenance, gather new baseline readings.
What vibration analysis helps you prevent
A good vibration program can prevent or mitigate:
| Failure Type | Typical Emergency Cost | Typical Planned Cost | Lead Time Provided |
|---|---|---|---|
| Bearing failure | $75,000 - $150,000 | $15,000 - $30,000 | 3-6 months |
| Coupling damage | $25,000 - $50,000 | $5,000 - $12,000 | 2-4 months |
| Shaft damage | $100,000+ | $20,000 - $40,000 | 4-8 months |
| Motor failure | $40,000 - $80,000 | $8,000 - $20,000 | 2-6 months |
It also improves your capital planning because you can make decisions with data instead of anxiety.
Emergency Shutdowns Per Year
Saved 4
Common mistakes in vibration programs
| Mistake | Consequence | Solution |
|---|---|---|
| No baseline data | Every reading is a “maybe” | Collect baseline after commissioning or major service |
| Inconsistent measurement points | Apples-to-oranges trends | Mark measurement locations, use consistent technique |
| No integration with maintenance planning | Data collected but not acted on | Build action triggers into PM program |
| Ignoring operating conditions | Misleading trends | Document load and speed with each reading |
| One-time “inspection” mindset | Missed developing issues | Commit to ongoing trending program |
Decision guidance: when to take action vs monitor
Because exact thresholds depend on equipment and manufacturer guidance, the best facility-side rule is:
| Observation | Risk Level | Recommended Action |
|---|---|---|
| Stable readings, within baseline | Low | Continue normal monitoring |
| Gradual upward trend over multiple readings | Medium | Schedule investigation within 30-60 days |
| Sudden step-change in vibration | High | Treat as urgent, investigate within 7 days |
| Rapid increase or alarm condition | Critical | Reduce load or shut down, investigate immediately |
Oklahoma-specific “when to check more often”
Increase attention:
- before peak summer season
- after wind/dust events if your plant sees abnormal cycling or condenser issues
- after major electrical events or restarts (storm season)
This isn’t superstition—it’s timing your condition monitoring to when your equipment is most stressed.
Need a predictive maintenance program for chillers?
Total Mechanical Services supports commercial chiller condition monitoring and maintenance planning across Oklahoma. Call (405) 223-9900 or request a proposal.
Disclaimer: This guide is informational and does not replace OEM guidance or qualified vibration analysis. Measurement points, thresholds, and interpretation should follow manufacturer recommendations and best practices.
Related Resources
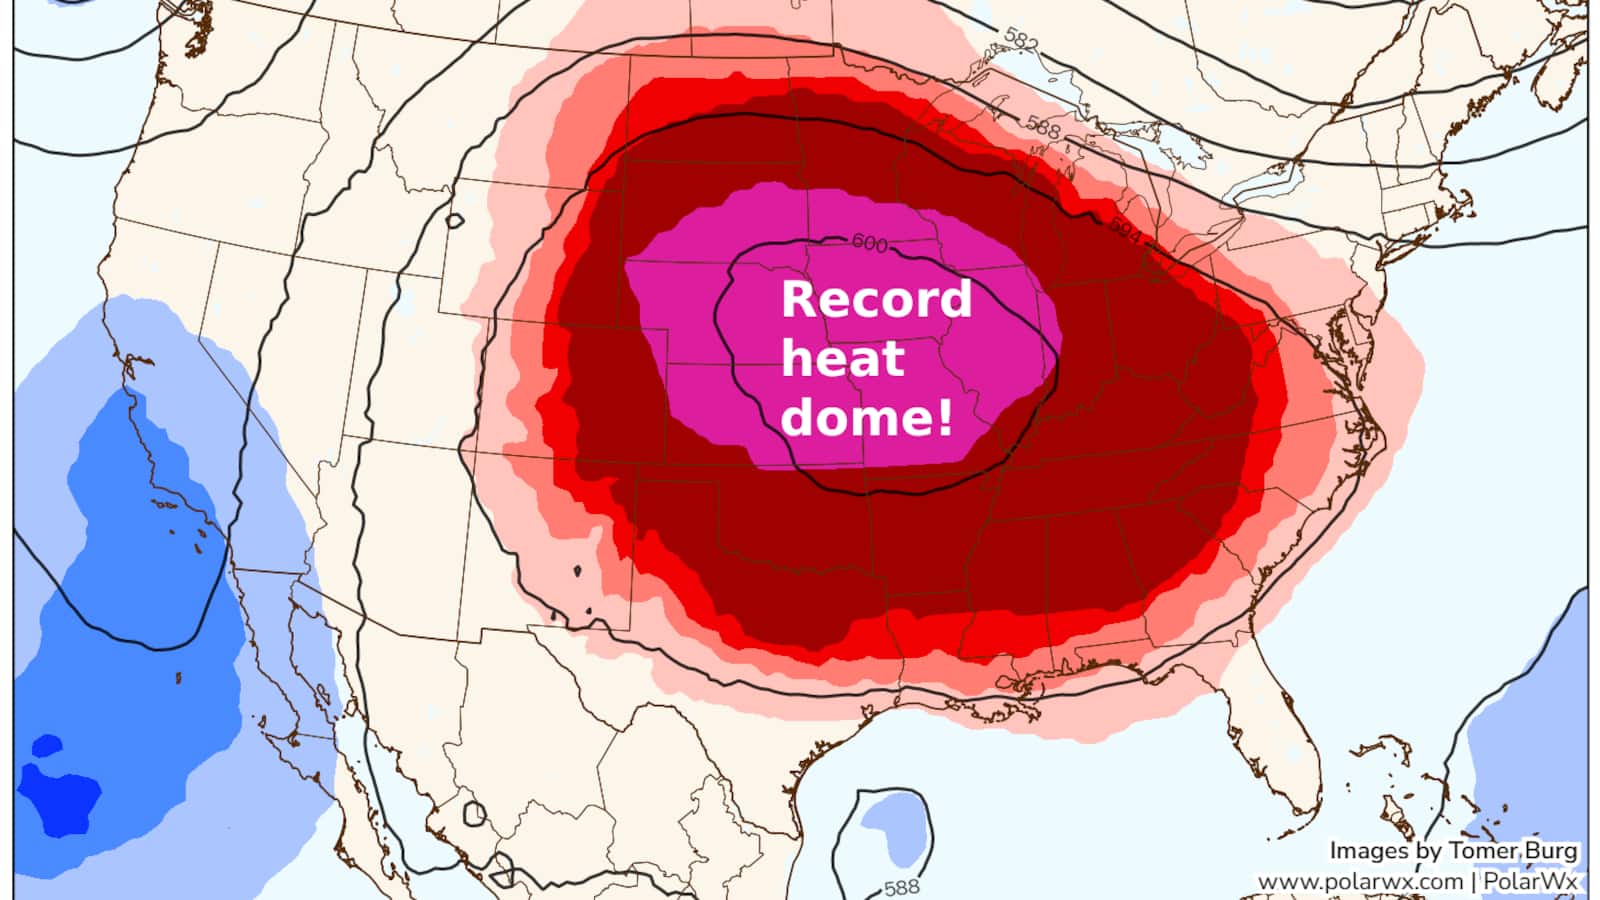
Protecting Commercial HVAC From Oklahoma Heat Domes: High-Ambient Strategy, Coil Cleaning, and Load Management
A practical Oklahoma guide to surviving heat domes: high-ambient chiller/RTU performance, coil cleaning cadence, tower readiness, demand management, and emergency cooling planning.
Commercial Chiller Tube Cleaning in Oklahoma: Frequency, Methods, and Hard-Water Reality
A field-practical guide to chiller tube cleaning for Oklahoma facilities: how hard water and tower chemistry affect efficiency, how often to clean, and what methods work.

Oklahoma Ice Storm HVAC Recovery: Freeze Damage Triage, RTU/Chiller Plant Checks, and Safe Restart
A practical Oklahoma guide to recovering HVAC after ice storms: pre-storm prep, freeze damage triage, thaw and restart strategy, and documentation for insurance and risk control.
Need Help with Your System?
Our expert team is ready to assist with design, installation, maintenance, and troubleshooting.